He has been working on a project to help ensure that climate data is of sufficient quality to draw reliable conclusions and shape decisions.
We are measuring our planet like never before, which gives us a huge opportunity to track the changes in our climate. What are some of the challenges of analysing satellite data?
‘One of the main concerns we had was that people might come to the wrong conclusions on how the Earth system is changing if the data are not of good enough quality, or if the data do not come with sufficiently clear disclaimers.
‘With historical data, an important issue is the quality of the raw data. Space agencies regularly update these records as their insight progresses into the behaviour of the instrument. The challenge lies in cross-calibration of the records from the different sensors.
‘Other difficulties are the intrinsic differences between satellite sensors – sensors observe the Earth at different times, and with different spatial and spectral resolution. It is no easy task to stitch a coherent data set together from sensors with such different specifications. ’
‘It is no easy task to stitch a coherent data set together from sensors with such different specifications.’
Dr Folkert Boersma, Royal Netherlands Meteorological Institute
Sounds difficult – do any other problems plague sensor data?
‘It is important to understand what’s going on in the atmosphere and on the ground that could distort our detection of trace gases. We need very good knowledge on the presence of clouds, the reflecting properties of the Earth’s surface and so on – so we can correct for their perturbations in order to provide realistic measurements of atmospheric concentrations. But how reliable is that additional information?’
You have been running a project called QA4ECV that aims to ensure the quality of climate data, and you’ve looked in particular at six variables – is that right?
‘There are 50 essential climate variables and QA4ECV has indeed been working on six of them. My colleague Professor Jan-Peter Muller, from University College London (UK), has been coordinating three variables: albedo (how reflective the Earth’s surface is), leaf area and FAPAR (which can provide an estimate of how much carbon dioxide is being assimilated by vegetation). And I am coordinating work on three gases: nitrogen dioxide, which is both a pollutant and a precursor of ozone, formaldehyde, which contributes to both carbon dioxide and ozone formation, and carbon monoxide, a toxic gas. The data do not come from uniform databanks but from a wide variety of satellite sensors.’
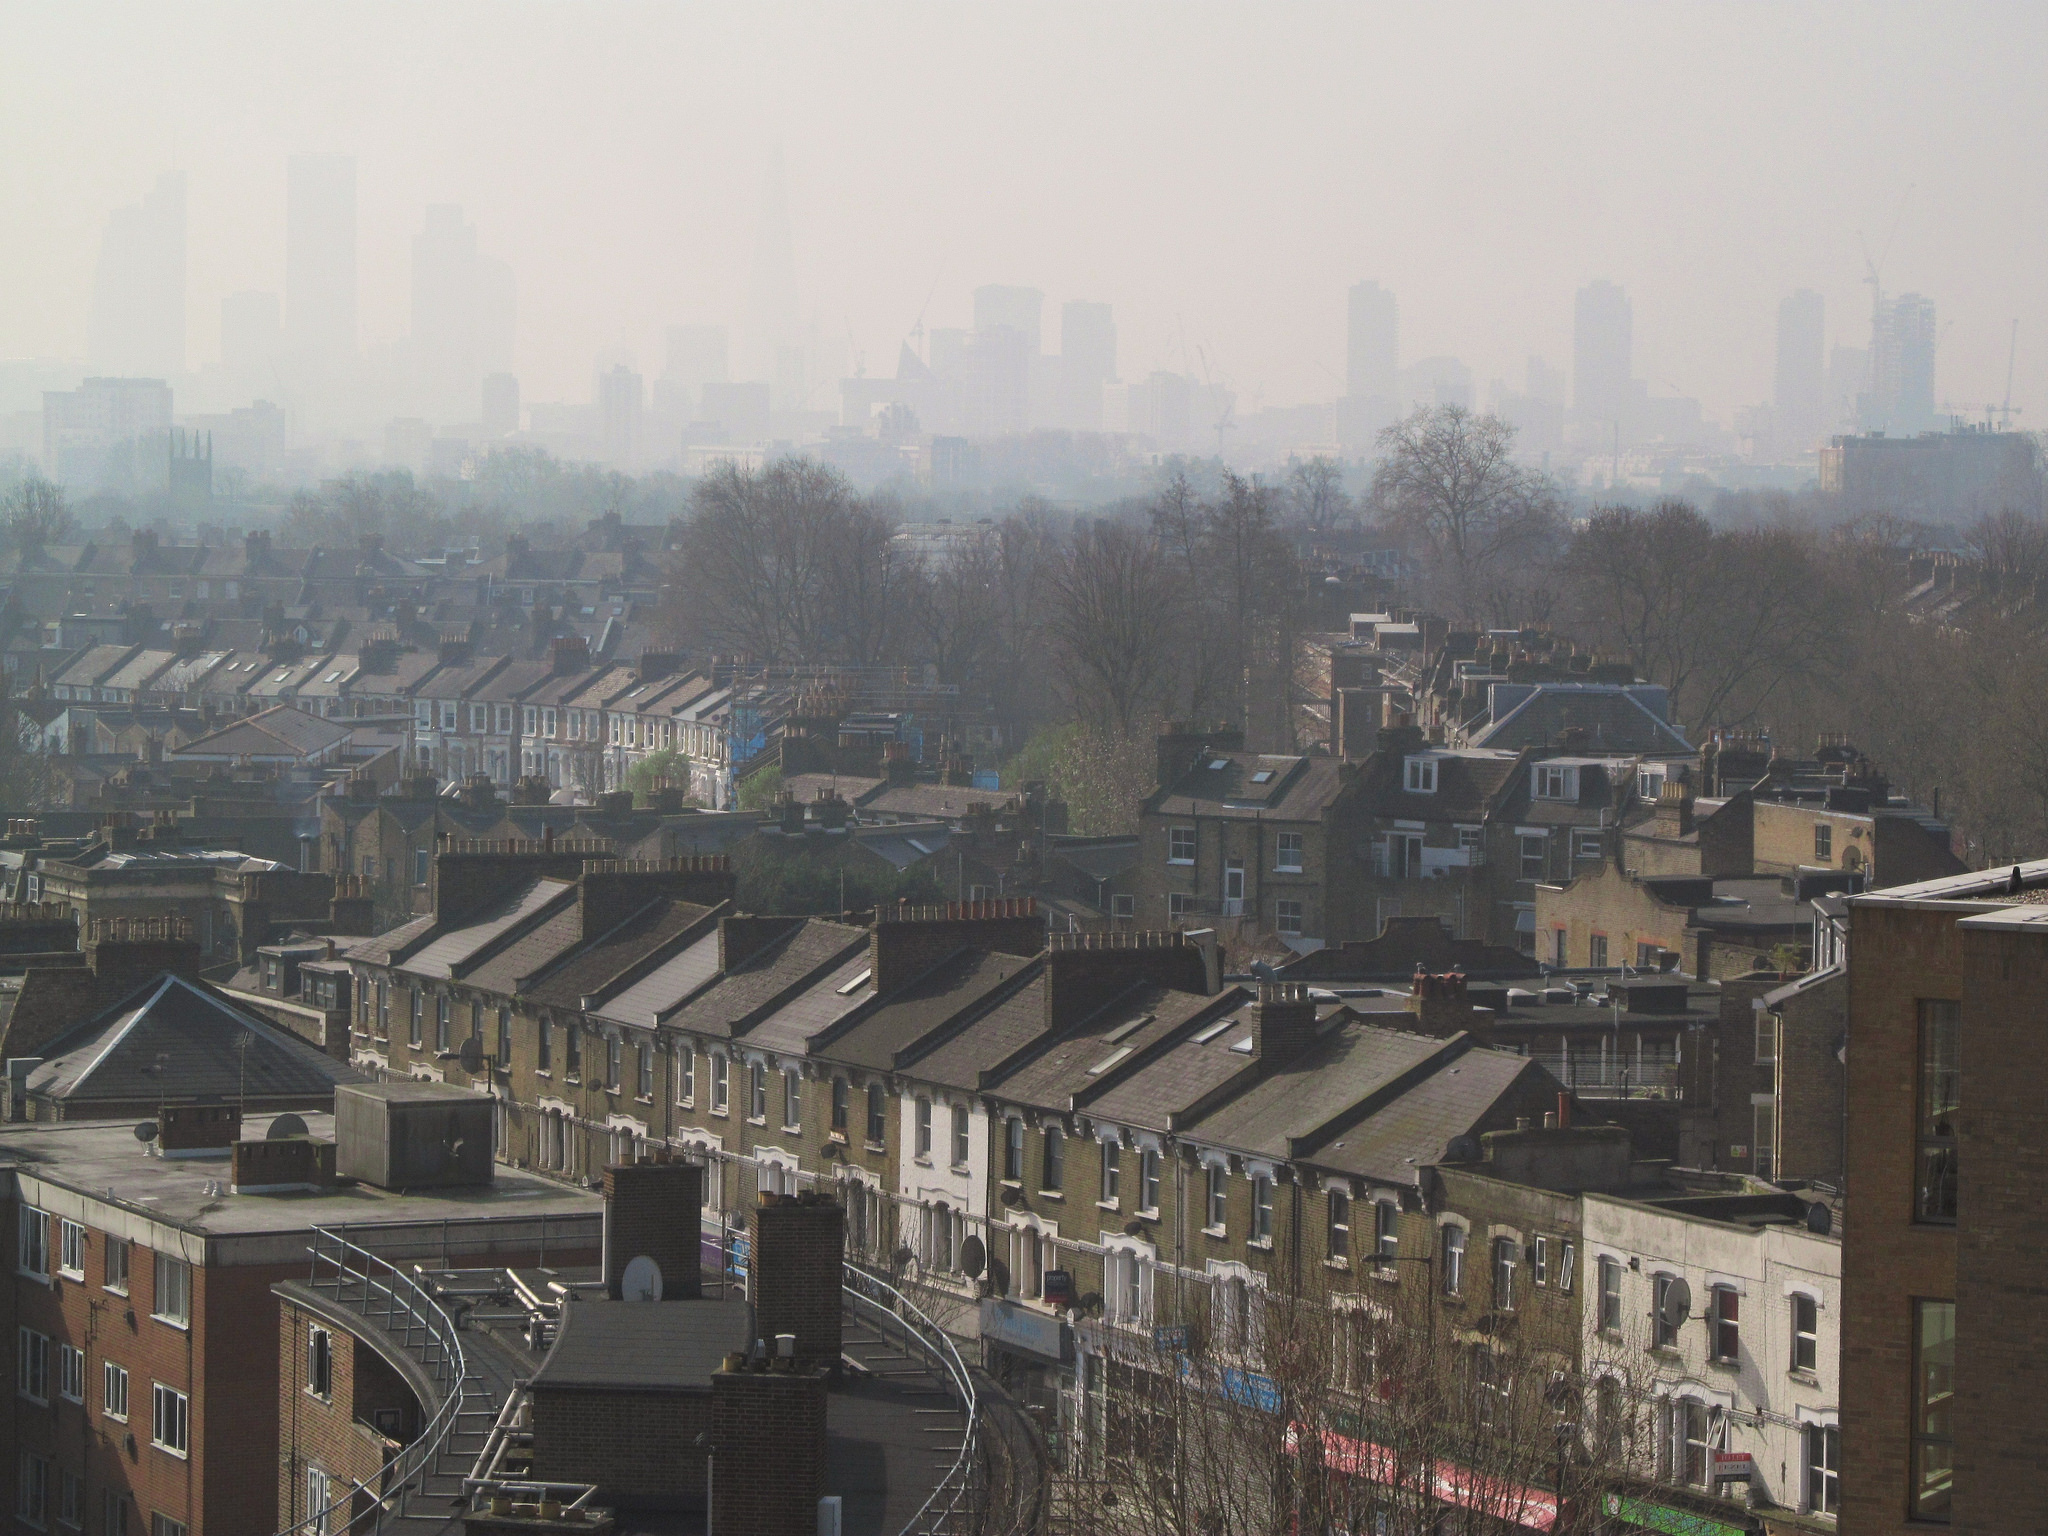
Nitrogen dioxide pollution is a hot topic in Europe. What did you find?
‘We’re currently doing a trend analysis for air pollution over the last 14 years in Europe to see how nitrogen dioxide levels are evolving. Now that we have this improved data set we can see clear reductions in the NO2 levels in the European air. The levels are substantially lower in 2017 than they were in 2005 when the monitoring instrument was just launched.’
What new information did your new data set provide?
‘It suggests a stronger downward trend in (nitrogen dioxide) pollution than was thought based on previous versions of the data set. It is still quite preliminary, but that’s an example of how improvements in our algorithm can change the perspective on how air pollution has been changing.’

In general, how do you know when you’ve got good or bad data?
‘Users of satellite data check whether it has been put to good use before, whether it has been validated, and whether their uncertainties have been characterised. One of the goals in our project was to generate a coherent and consistent framework for quality assurance of satellite data.’
How do you go about giving this treasure trove of information the seal of quality?
‘In multiple ways. One of the reasons why we think we’re doing a better job now is that we have revised the retrieval algorithms. On top of that, we have put the quality assurance system to work, which tells people how uncertain the data are, flags when to use or not to use the data, and gives best practices for use.’
Retrieval algorithms?
‘These are the steps we take to retrieve the physical measurements from the satellites and take account of all the other (necessary) factors … such as noise and that external information on clouds, surfaces, etc. We’ve gone through all the sub-steps that we need to take and put them to the test by doing comparisons with other groups. Sometimes we find a bug in the retrieval code. Sometimes we note that: “Hey – this group from Germany has a better best practice – let’s take it over”.
‘We have a lot better understanding now of where the uncertainties are in the various retrieval steps. And we’ve reduced the uncertainty in many of the sub-steps.’
So you’ve produced a type of refinery, where you can pour raw data in at one end and end up with a long record going back several decades of clean, consistent climate data?
‘Yes, and this is getting increasingly important. For example, Europe now has the big Earth observation programme Copernicus (the Copernicus Climate Change Service), the ambitious idea to be this huge source of climate data. For this programme to be successful, the data it provides needs to be quality-assured.’
Do you have any tips for people who produce these datasets?
‘More than that. Data needs to be reliable, traceable and understandable. We’ve developed a system everyone can use when putting out data to ensure this. It’s a list of requirements that good data should fulfil. It helps the people who produce the data and those who use it to find out where the data comes from and how uncertain it is (for example, there may be flags showing that you should be aware that the data may be affected by something like sun-glint).
‘So there are two outcomes of our project: we have developed a generic quality assurance system, and we have generated 30-year data records of atmospheric and land parameters relevant to air pollution and climate change.’
What’s next for this work?
‘Copernicus wants to take records for its climate data store, as well as using the quality information data. But it’s not a good permanent situation. One of the concerns we have is that there are currently no follow-up projects to keep on working on this data provenance and on improving the data.
‘This is a strong concern because there are new, extremely high-resolution sensors (such as those on the Sentinel satellites) that require new approaches, and consistency checks to ensure that their data is of sufficient quality to live up to the big promises made when millions of euros were poured into the design, assembly, calibration, and launch of these top-edge European instruments. The data quality should follow suit and remain to be of similar top-edge quality, and for this the European Union, ESA, and national science foundations should define more research calls for this type of work.’
Originally published on Horizon.